
Vitamins & Supplements Update Fall 2022
A $37 Billion Industry That Nobody Owns
Nearly 1,800 U.S. supplement manufacturers compete in a market where the top four players hold less than 15% of revenue. Our Fall 2022 update on why that fragmentation makes vitamins and supplements one of the most consolidation-ready categories in consumer health.

estimated U.S. vitamin, mineral, and supplement (VMS) industry revenue in 2022, after five years of 2.2% annualized growth that included a 3.6% Covid-driven jump in 2020.
the number of VMS producers in the U.S. The four largest hold less than 15% of industry revenue, and no company owns more than 10% market share.
trailing five-year operating margins for the smallest producers versus the largest. Scale pays in this category, which is exactly what fuels roll-ups.
a 73% jump over the trailing three-year average. Through September 2022 the industry ran at a full-year pace of 113, a 43% decline from that peak.
the precedent-transaction median. Retail and manufacturing businesses traded at 3.0x to 4.5x, while R&D-focused companies traded near 17.4x.
the share who take supplements daily, versus a 68% national average, and the 65+ population grew at a 3.0% annualized rate over the five years ending 2022.
Executive Summary
Over the past decade, and even more so over the past 3 years, consumers are increasingly evaluating the products used to fuel their bodies and the impact this consumption has on overall health and wellbeing. Correspondingly, scientific research has allowed us to better understand the effect of key nutrients on human physiology, and technology has allowed businesses to provide customized solutions specifically tailored to individual needs. This backdrop provides a tailwind for nutritional vitamin and supplement demand at the consumer level.
As it stands, the industry is relatively fragmented. This fragmentation, combined with a highly competitive operating profile, provides an environment ripe for consolidation, and therefore supports future M&A activity.
Industry Overview
The U.S. Vitamin, Mineral, and Supplement industry (“VMS”) consists of companies which develop, manufacture, and sell consumable over-the-counter products containing ingredients intended to enhance the human diet and overall health. Specific segments of this industry include traditional vitamin and mineral manufacturers, as well as sports nutrition and athletically focused supplements. As defined, the industry explicitly excludes businesses producing pharmaceuticals, over-the-counter medications, and pet health products. The total VMS industry can be divided into 5 further sub-segments: Vitamins & Minerals, Herbs & Supplements, Sports Nutrition, Meal Supplements, and Specialty. Of these 5, the largest portion consists of vitamins and minerals, comprising roughly 40% of total sales.
The total U.S. VMS industry is estimated to generate ~$37B of revenue in 2022. Over the past 5 years, the industry has grown at an annualized rate of 2.2%, notably with a 3.6% year over year jump in 2020 induced by Covid. Expected growth for the next 5 years is marginally more modest, at an annualized rate of 0.9% through 2027. (Source: IBIS World)
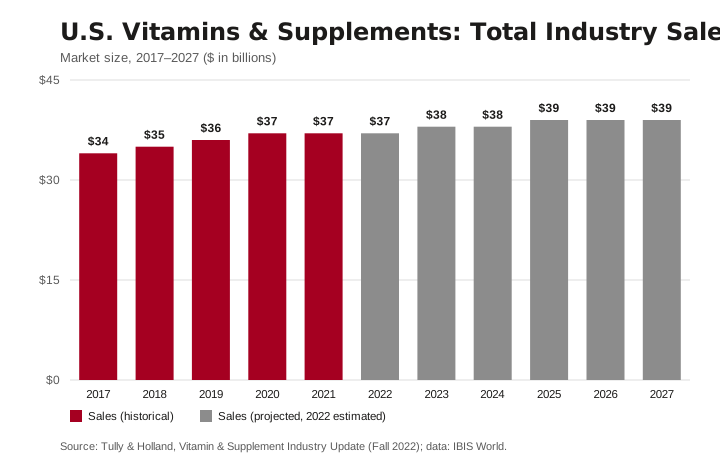
This slowing growth is primarily a return to normalcy following the Covid-induced expansion. We identify a number of socioeconomic factors discussed later in this update which support reasonable top-line growth projections.
Industry Drivers & Themes
With regard to the end consumer, perhaps the broadest driver of VMS demand is the general health conciseness of the US population. Survey data indicates that supplement users are more likely to target a balanced diet, exercise regularly, maintain a healthy weight, keep up with routine medical checkups, and stay hydrated when compared to non-supplement users (Source: Statista). Increased focus on healthy living has been a trend for decades, one which was further accelerated during the Covid-19 pandemic. Supplement users across the age spectrum are increasingly focused on the products used to fuel their bodies in order to maintain a greater quality of life longer into the future.
With regards to the M&A market, we see a number of factors which indicate an industry ripe for consolidation. As it exists today, the VMS manufacturing industry is exceptionally fragmented. Cost pressures and the likelihood of increased regulatory scrutiny should provide impetus encouraging consolidation, which would support higher deal volume.
Demand Drivers & Consumer Themes
- Aging Population: Broadly, the US population is aging. For the 5-year period ending 2022, the number of Americans over 65 has increased at an annualized rate of 3.0%. This demographic shift is expected to persist, providing demand momentum for end-user consumption of supplements. Nutritional supplement consumption tends to increase with age. Nearly 75% of people over the age of 55 consume supplements daily, compared with a national average of 68% (Source: Council for Responsible Nutrition). Producers can respond by introducing new products targeting this age group and capitalizing on the demographic trend.
- Consumers Prefer Personalized Products: Technological innovation has enabled manufacturers to produce personalized products based upon an individual’s health and lifestyle characteristics and deliver these personalized products at a reasonable cost. Naturally, this dynamic shifts the method of product delivery primarily to a direct-to-consumer model, as opposed to traditional brick and mortar or wholesale distribution. Delivery of customized products via these legacy channels is simply not practical. These products become somewhat “sticky”, meaning consumption becomes habitual and recurring. This is supported by a subscription model, in which the consumer’s customized supplement supply is replenished automatically at regular intervals. This customized space has taken off in the past 3 years and includes companies such as Rootine, geno palate, and Care/of.
- Rise of Sports Nutrition: While the entire VMS market has grown over the past 5 years, no segment has grown as rapidly as sports nutrition. The overarching theme of increased health consciousness is closely related to another trend: athletic participation. For various reasons, Americans have increased their participation in athletic activities in recent years (Source: Statista). This was accelerated during the pandemic, when outdoor athletic activities were considered to be a more appropriate substitute for social indoor gatherings. Participants increasingly view supplements as a nutritional compliment to their athletic lifestyle –particularly those partaking in cardiovascular endurance activities such as running, cycling, and hiking. Performance-focused individuals tend to be willing to pay a premium for products that they believe will enhance their athletic results.
M&A Drivers
- Industry Fragmentation Provides a Catalyst for M&A Activity: Currently, it is estimated that there are nearly 1,800 VMS manufacturers in the United States. These market participants tend to be regional players, specialized in one specific product segment. Production concentration is low, with the largest 4 players making up less than 15% of total industry revenues and no one company owning greater than 10% of market share. Roughly half of this total consists of businesses generating revenues of less than $5M per year. The business model itself is generally fixed-cost intensive, with a moderately high degree of operating leverage. This dynamic generally favors larger compnaies, with the ability to achieve economies of scale through greater production volumes. This can be exemplified by comparing the operating margins of different sized businesses: the trailing 5-year operating margin of the aggregated industry players in the $1M to $5M revenue bucket is 7.6%. This same metric for the largest companies in the >$500M revenue bucket is 23.8%. This backdrop presents an industry landscape which is well-positioned for M&A deal activity – the high potential for cost synergies and operational efficiencies should provide attractive consolidation opportunities for industry players. (Source: IBIS World, Statista) There are several key pillars to success that relate almost directly to scale: marketing, distribution network, and access to the best input ingredients are all cited as crucial competitive advantages. Larger firms are able to command greater negotiating leverage from their position in the supply chain, incentivizing smaller firms to consolidate.
- Increase in Regulatory Enforcement: The VMS industry is regulated by the FDA at the manufacturing level, and products are currently treated as food, not drugs. There is a general expectation amongst industry analysts that regulatory pressures will increase over the next 5-year period, primarily in the form of increased enforcement of existing regulation and greater scruitny of new product categories. This shift naturally creates a greater number of hurdles for all industry players, but is likely to have outsized impact on smaller scale firms. Ensuring compliance and working with regulators takes internal resources. Smaller companies are less likely to have the available resources specifically dedicated to this task, and therefore proportionally will likely incur greater costs to do so. In contrast, larger companies with greater scale are able to spread this cost across greater volume, and as a result should see a lesser degree of marginal impact. Separately, there is likely to be increased scrutiny of international product imports. The FDA has expressed concern regarding the sourcing of foreign ingredients and health and safety policies around international manufacturing. This should prove to be another positive factor for domestic producers, who are considered to be more trustworthy with regard to their input components and manufacturing processes.
- The Rise of CBD: One exceptionally strong catalyst for the space is the rise of CBD as a supplement/treatment for various ailments. While still a complicated matter to some extent given its interconnection to the various marijuana legislative debates, CBD on its own is now approved for use in all 50 States. And, while the jury remains out on the efficacy of CBD treatments at the medical level (and the FDA may eventually opine upon this), there is no questioning its rising popularity across all manner of compounds and infused products within the consumer space. This fact certainly has not been lost on venture capital, private equity, investment, and strategic constituencies where the M&A space as seen a drastic increase over the past few years In the prior 2-to-3-years, there has been an uptick in CBD-related deals, many of which are detailed in the appendix of this report. We expect research and consumer demand to continue into the near future, likely creating opportunities for players in the space. The key risk lies within a change to the regulatory environment – while there is little evidence to suggest an overall tightening of CBD regulation, there will likely be some matter of change in which products, producers, and distributors are more consistently and uniformly controlled.
M&A Landscape & Deal Market Activity
Vitamins, Minerals, & Supplements Transaction Highlights
Deal activity has occurred throughout the entire industry supply chain, from ingredient producers and contract manufacturers to retailers and direct to consumer sales platforms. The select transactions noted below highlight strategic initiatives by larger firms to enter new regional markets and diversified product lines.
- The company, a subsidiary of Aurobindo Pharma, was acquired by Jarrow Formulas, via its financial sponsor New Mountain Capital, through a $550 million LBO.
- Proceeds from the company's divestiture will be used by Aurobindo Pharma to reduce debt and launch new strategic initiatives.
- The company was acquired by Humble Group (STO: HUMBLE) for SEK 22 million on January 1, 2022.
- Through the acquisition, Humble Group is now expanding into the Norwegian market.
- The company was acquired by Humble Group (STO: HUMBLE) for SEK 17.7 million on October 15, 2021. Of the Purchase Price, approximately SEK 8.9 million will be paid in cash and the remaining approximately SEK 8.9 million in the form of 334,767 newly issued shares in Humble, which will be issued at a price of SEK 26,445.
- With the acquisition, Humble will gain access to several attractive brands in health products and strengthen the group's offering in contract manufacturing and broaden the range of products that can be sold B2B.
- The company was acquired by Catalent (NYS: CTLT) for approximately $1 billion on October 1, 2021.
- The acquisition will enable Catalent to expand its current consumer health technology platform with a wider range of technologies and ready-to-market product libraries as well as a variety of packaging options to meet customers' branding needs.
In the section below we discuss M&A through 3 lenses:
- Deal Volume refers to the absolute number of deals, regardless of size.
- Capital Deployment refers to the total amount of currency (in this case US Dollars) invested into the space, and
- Valuation refers to the acquisition price paid, relative to the operating fundamentals of the business.
M&A Transaction Activity: Deal Volume
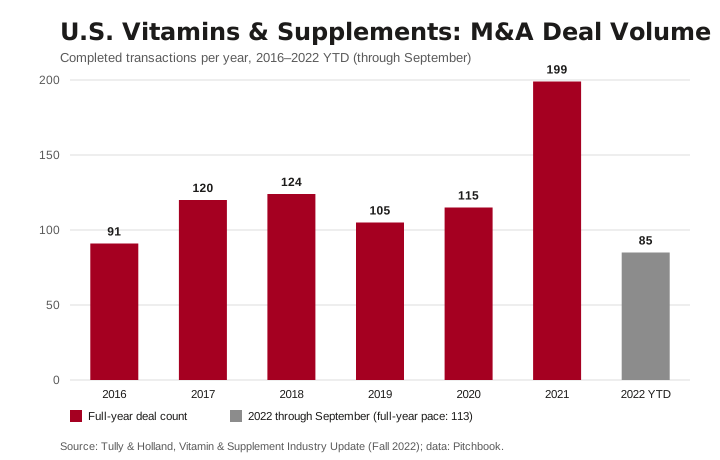
2021 saw a sharp increase in deal volume, with the number of transactions jumping to 199 in the US – a 73% increase compared to the trailing 3-year average. This figure is aligned with the broad market, which realized a similar jump in 2021, propelled by low interest rates and a rebound from 2020’s Covid-depressed activity. When smoothing out the data over the 5 years ending 2021, industry deal volume has increased at an annualized rate of 17%.
To date, 2022 has seen a steep decline in deal volume on a year over year basis. Through September, the VMS industry is on pace to complete 113 deals, which would indicate a 43% decline from 2021 and a 15% decline compared to the 5-year average. We see this as primarily driven by the macroeconomic environment, as rising interest rates and an uncertain economic outlook have caused investors to evaluate opportunities with greater scrutiny and therefore slow deal volume.
M&A Transaction Activity: Capital Deployment
While deal volume is on pace to be down 43%, capital deployment is expected to be down roughly 50%, driven by overall smaller average transaction sizes. The median deal size in 2022 is down roughly 25% compared to 2021, and down 30% relative to the 5-year average. Notably, the median size of strategic deals oscillates in a fairly consistent range, with transaction values concentrated around $20M. The median deal size of financial buyers fluctuates materially, ranging from a low of $1.2M in 2020, to a high of $328M in 2021 – however this is primarily explained due to a small sample size of available data and is therefore not a high-quality indicator.
Valuation Overview
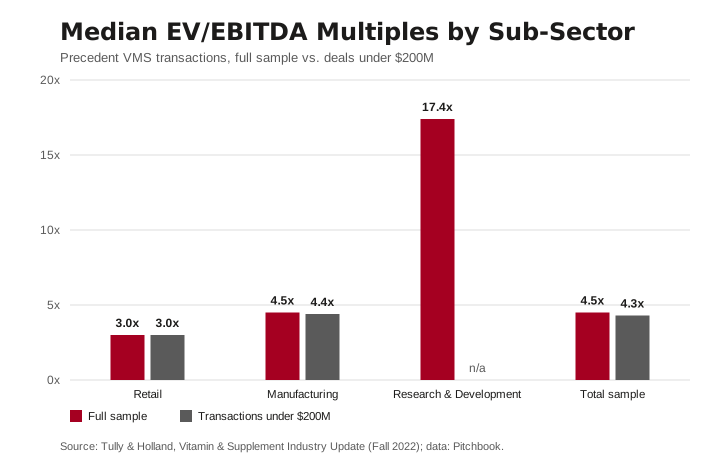
At the highest level, there is a wide amount of dispersion between recent transaction multiples. Overall, we have observed an Enterprise Value (“EV”) EV/Revenue multiple range of 0.2x to 6.2x, with a median of 0.8x. EV/EBITDA multiples have a similar amount of dispersion, ranging from 2.6x to 27.1x and a median of 4.5x. It appears that the primary driver of the valuation multiple is the sub-sector in which a specific business participates. While the data can be sliced in many ways, we have chosen to segment and extract 3 different sub-sectors: retail, manufacturing (including contract manufacturing), and research and development (including contract research). The charts on the following page highlight the valuation discrepancies between these sectors: while retail and manufacturing businesses have traded between 3.0x and 4.5x on an EV/EBITDA basis, R&D companies have traded nearly 4 times this amount, up to roughly 17.5x.
Public market multiples exhibit a similar level of dispersion. EV/Revenue multiples range from 0.2x to 32.5x, and EV/EBITDA multiples range from 3.7x to 32.9x. The median valuations are 0.8x and 6.4x for each category, respectively. The same sub-sector trends can be observed as in the private market transaction data, with the R&D focused businesses commanding relatively higher multiples than their retail and manufacturing-oriented counterparts.
Conclusions
A long-running socioeconomic shift toward increased health consciousness was further accelerated during the pandemic. Consumers realize that there is simply no substitute for good health, and are increasingly focused on treating their bodies with greater care and respect. Whether through diet, exercise, or a combination of both, supplement consumption is a core tenant of this perception. Technology has provided us with the ability to precisely identify areas of deficiency based upon each individual’s unique body chemistry. This has opened a market for producers to specialize products at the individual consumer level and created a new wave of innovation.
As it stands, the VMS industry, particularly on the production and manufacturing side, is fragmented. The potential for economies of scale driven by operational efficiencies should provide incentive for consolidation and support strategic deal volume into the near future. We believe that companies interested in pursuing this consolidation strategy have the potential to unlock significant value via cost savings and product-market diversification. At Tully & Holland, we have had the privilege of working with several companies in the space over the last few years, ushering them through the corporate advisory process. We would welcome the opportunity to share with you what we’ve learned and to discuss any strategic alternatives or avenues of further growth that you are currently considering.
Text reproduced from the report as published by Tully & Holland. Photograph: Tamorlan, CC BY 3.0, via Wikimedia Commons.
Keep reading

Beauty Industry Update Fall 2023
The industry erased its pandemic losses within two years and kept growing straight through the inflation shock. Our Fall...
Read →
Kombucha Industry Update Winter 2024
A fermented tea that started on health-food shelves reached $2.8 billion in U.S. revenue in 2024, growing 19.7% a year s...
Read →
Craft Beer Industry Update Summer 2024
Nearly 10,000 US breweries produced $29 billion in 2023 sales, yet production declined for the first time in the modern ...
Read →